
There is a tremendous amount of software available for students when it comes to graphing. The choice can be daunting, but choosing the right tool for the job can simplify homework and papers. This document outlines some of my favorite choices.
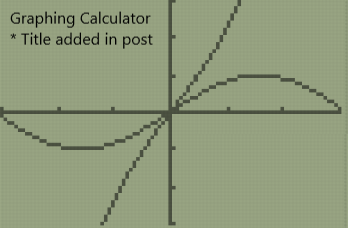
Most students will encounter both the traditional graphing calculator, usually of the Texas Instrument variety, and Desmos software in their high school education. Both tools are quick and can be mastered in a relatively short amount of time.
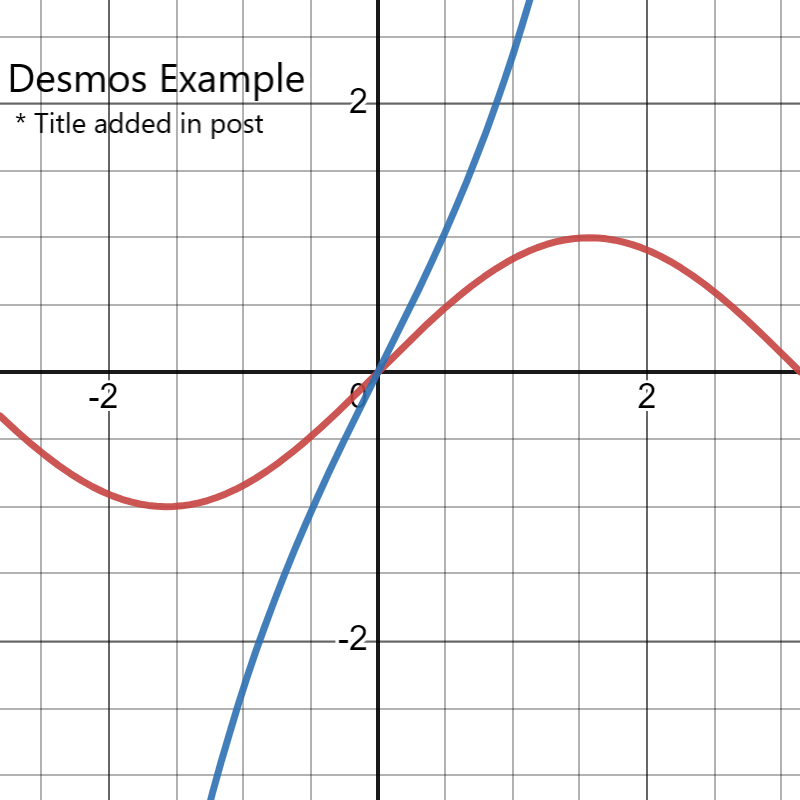
Desmos has a more intuitive interface in my opinion, and can be used in the browser or on your phone. The two versions mostly have the same features and come preloaded with example graphs to help you learn about plotting options. Additionally, discussion on College Board's official Twitter account has confirmed the digital SAT (still in testing phase, to be introduced in the US from early 2024) will have the Desmos calculator available for test takers.
Desmos is a must-learn for students but is not without some drawbacks. The first major drawback is that there are plenty of teachers who only allow traditional handheld calculators for exams. For this reason, I always advise my students to discuss the testing structure with teachers far in advance. Graphing calculators have a learning curve slightly steeper than Desmos, so learning both at the appropriate time for their particular class/case is important.
One final drawback to the aforementioned options is that both have limited options for customizing and exporting graphics for papers.
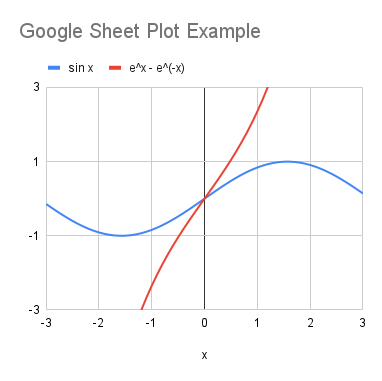
In most cases, students' first experience with generating graphics for papers is in the context of science labs. Luckily, dealing with a table of data points is the main focus of spreadsheet software like Excel, Google Sheets, and OpenOffice Calc.
As with all of the options on this list, there is a lot more to the software than just plotting, but in this case you can work with plots without understanding the entirety of the software.
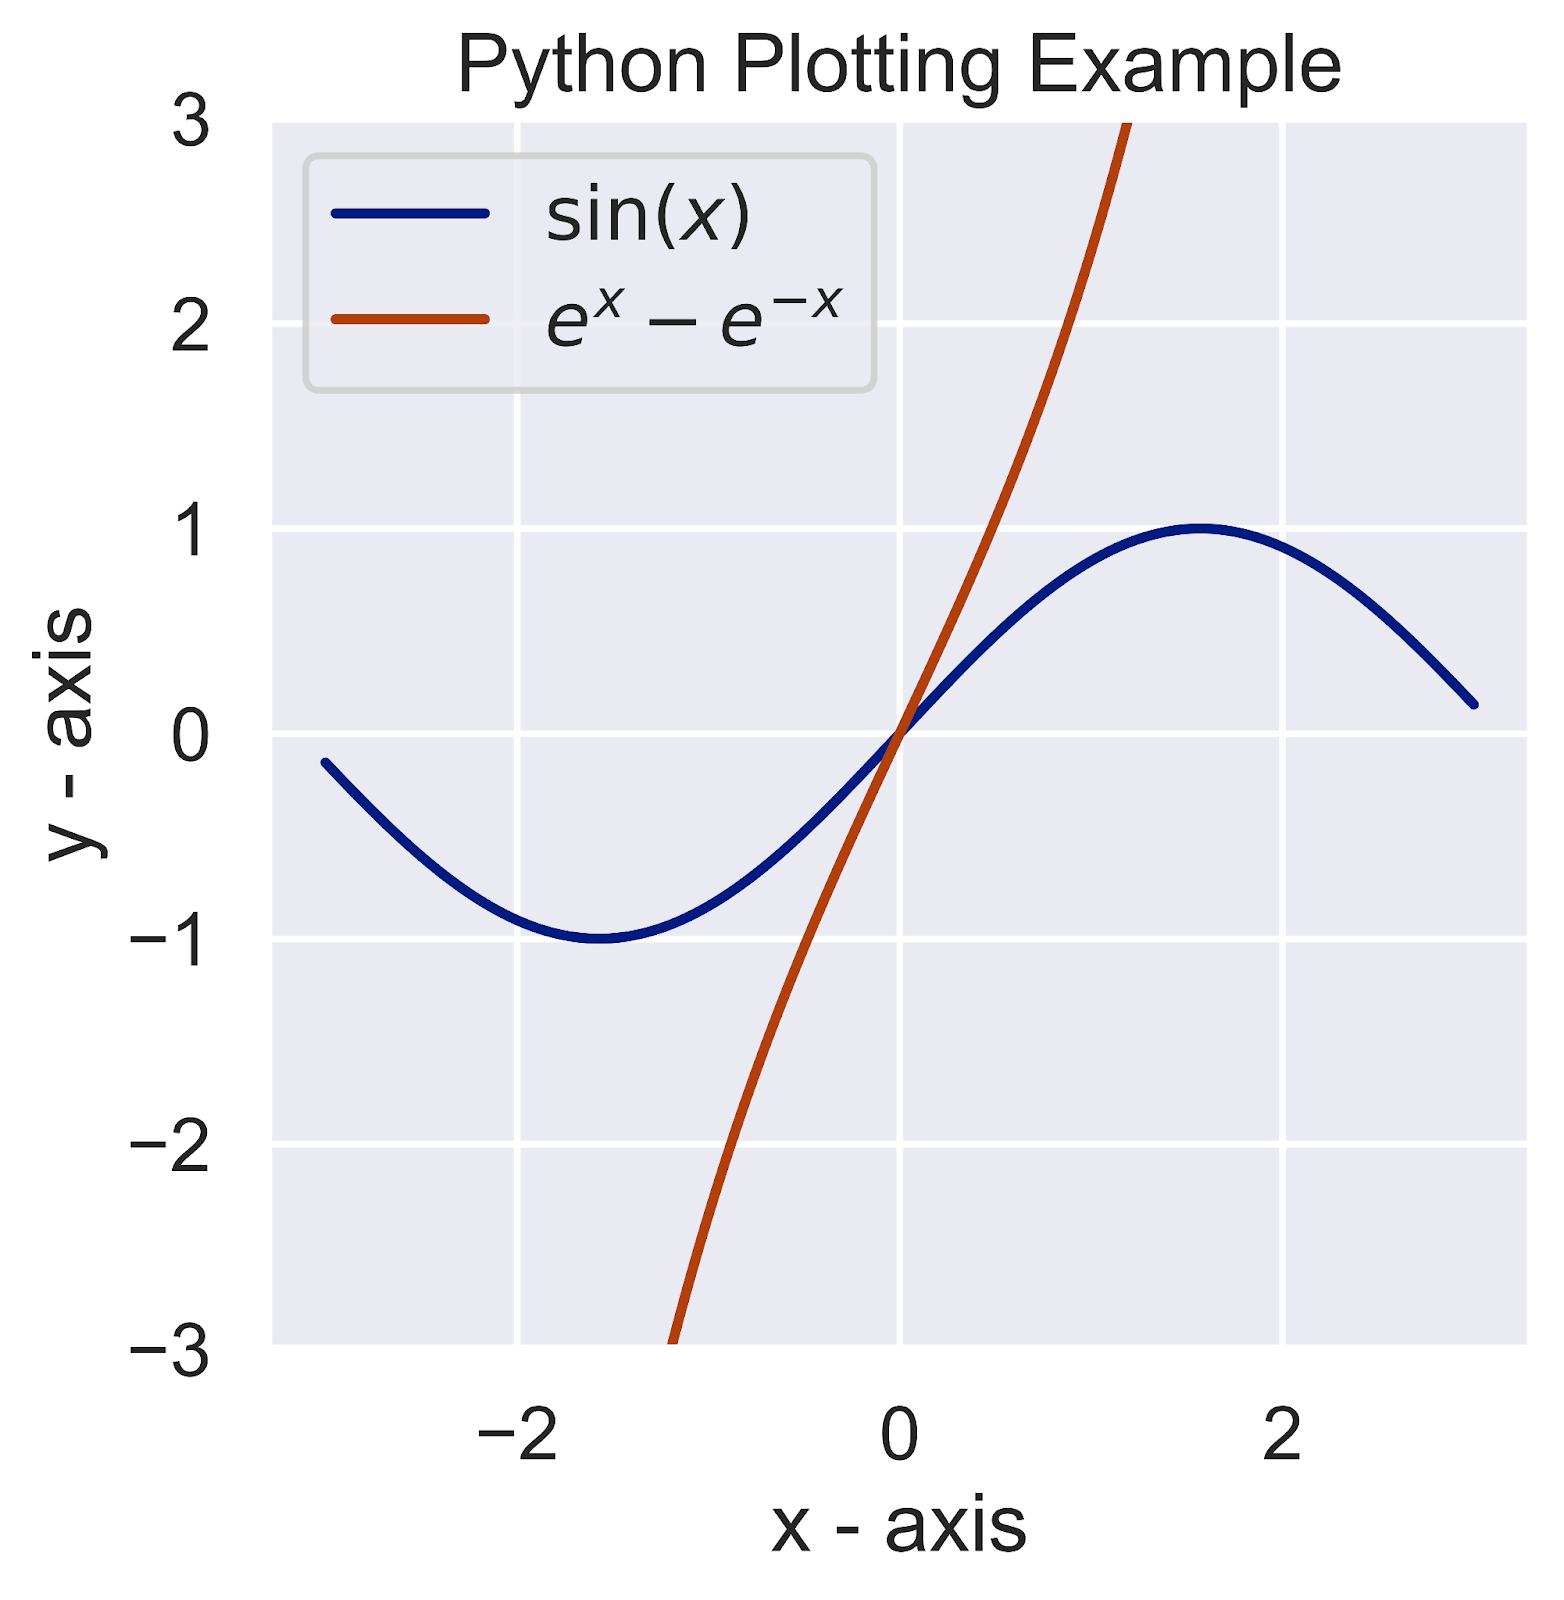
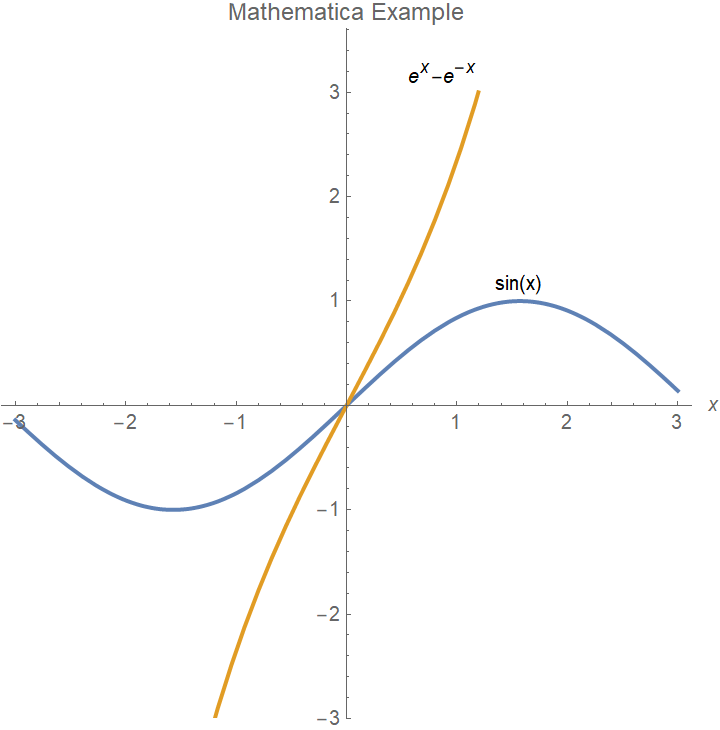
Spreadsheet software offers numerous styles and formats for figures; however, if you need to automate figure creation or have control over every detail you will need to use something like Python, Matlab, or Mathematica. These options will take a much longer time to master and as such are highly marketable skills.